Probabilistic climate model benchmarking
ClimateBench v2 is a standardized protocol for evaluating any climate model (a traditional physics-based Earth system model, a data-driven emulator or AI climate model, or a hybrid that embeds learned components in a physical core) on diagnostics expected to be informative for its skill at projecting mid-century regional temperature and precipitation change. It is developed with a broad community of collaborators from modeling centers, universities and industry, and is described in Watson-Parris et al. (2026), ClimateBench v2.0: Probabilistic Climate Model Benchmarking.
Context and motivation
Climate projection is an out-of-distribution problem: the multi-decadal forced response is never directly observable on a useful timescale, so, unlike weather forecasting, there is no simple held-out test set. This has made scoring climate models both important and difficult, and “model democracy” (treating every model as equally plausible) persists despite evidence that it is suboptimal.
The rapid development of machine-learned and hybrid climate models makes the question more pressing. Data-driven models can easily achieve low error on present-day statistics by exploiting shortcut features or memorizing historical forcing correlations, mechanisms that break down under unseen emissions pathways. And because climate projections are inherently probabilistic, a single deterministic projection is not a meaningful target.
ClimateBench v1 evaluated emulators against held-out simulations of the Earth system model they were trained on. That framing cannot assess models that generate their own climate, so ClimateBench v2 instead defines an observational and out-of-distribution ground truth against which all model classes can be compared. The benchmark task is deliberately narrow:
Given a plausible future emissions pathway, what will regional temperature and precipitation changes be in 2050 relative to 1995–2014?
A held-out observational record
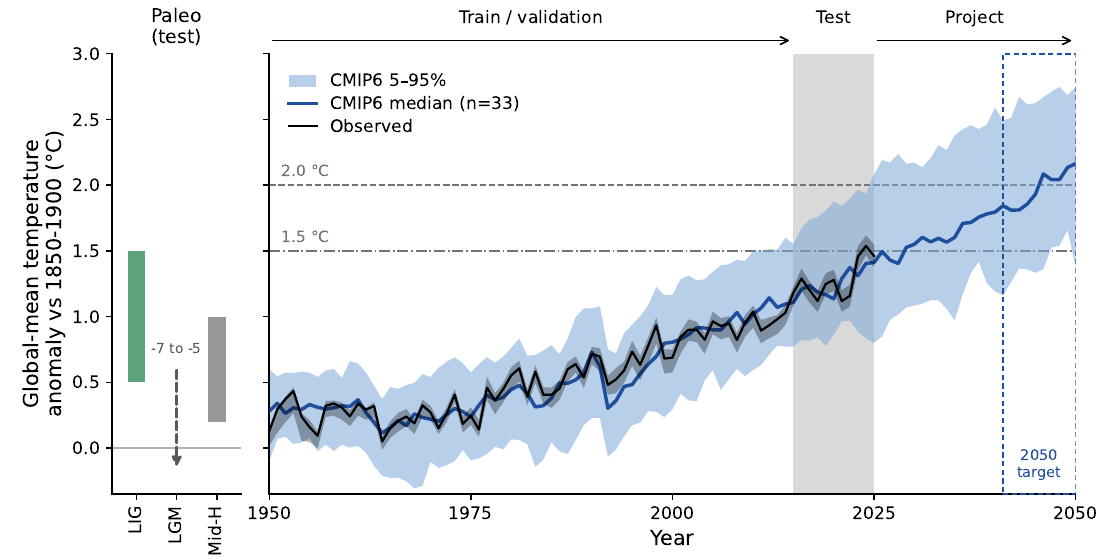
The CMIP6 historical experiment ends in 2014. The decade since is the best-observed period in history, spans nearly a third of total warming to date, and was unavailable when the current generation of physical models was developed and tuned. ClimateBench v2 therefore reserves all observations from 2015 onward as a test set, and requires data-driven submissions to train only on data up to 2014, the same information available to the CMIP6-era physical models. In an idealized single-model experiment, adding the 2015–2025 window halves the posterior variance of the 2050 warming, so this record carries real information about the benchmark target.
Three tiers of evaluation
- Tier I: Entry ticket. Pass/fail tests of physical credibility: top-of-atmosphere energy balance and drift, water and energy budget closure, physical covariances, ENSO variability and teleconnections, basic forced responses to abrupt-4xCO2 (land–ocean warming contrast, Arctic amplification, ECS), aerosol forcing, meridional heat transport and the ITCZ–energy-flux-equator relationship.
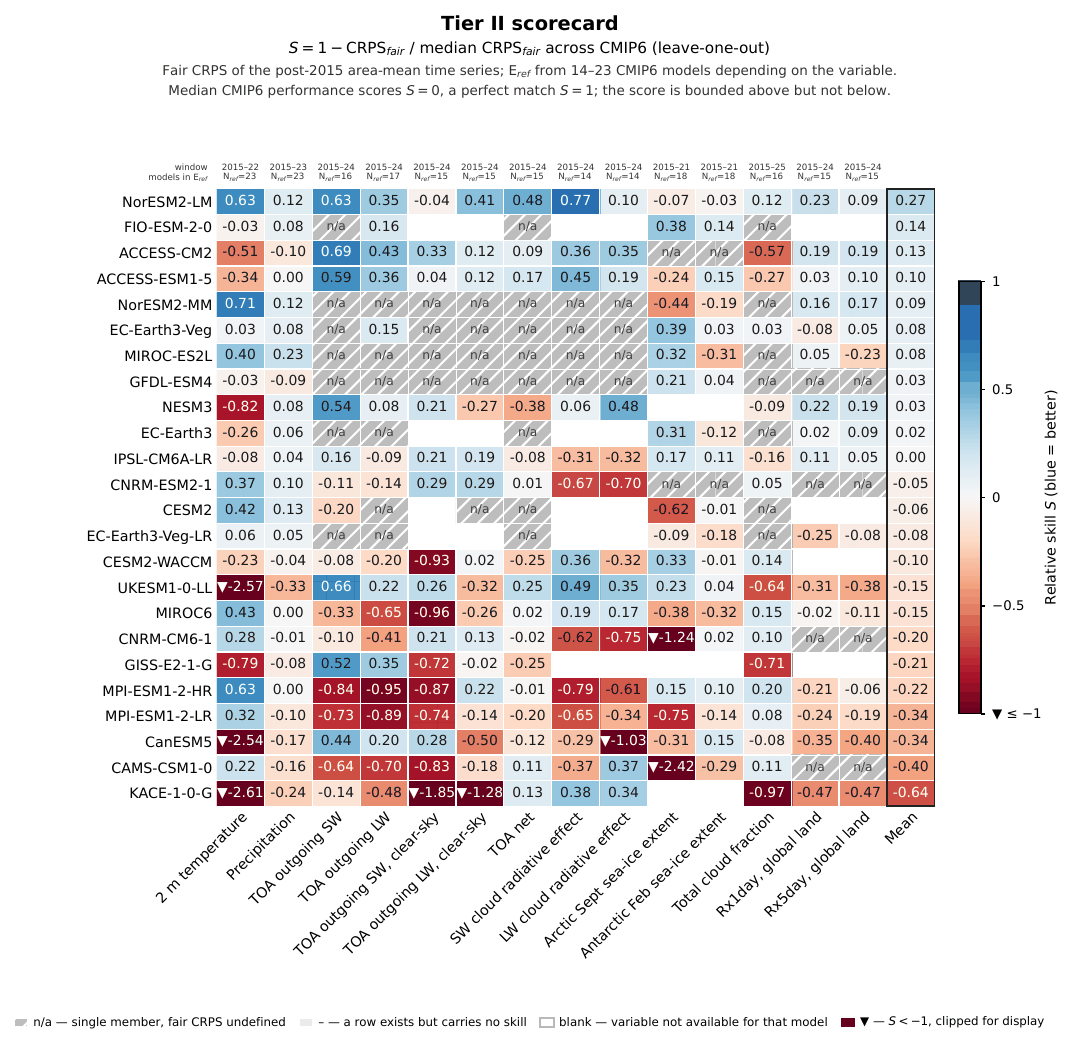
- Tier II: Probabilistic scoring against observations. Multi-member ensembles are scored against the post-2015 record of surface temperature, precipitation, radiative fluxes, clouds, sea ice and extremes using the fair continuous ranked probability score (CRPS), complemented by distributional and ensemble-consistency diagnostics. Scores are reported as skill relative to the median CMIP6 model, with climatology and pattern-scaling baselines for context.
- Tier III: Out-of-distribution generalization. Paleoclimate simulations of the Last Interglacial, Last Glacial Maximum and Mid-Holocene are compared with proxy reconstructions, and perfect-model experiments test whether data-driven models trained only on historical output can predict the future climate of ESMs spanning the CMIP6 range of climate sensitivity.
Rather than collapsing performance to a single leaderboard rank, results are reported as a multi-dimensional scorecard across tiers, variables and regions, so that trade-offs (for example, skill on temperature but not precipitation, or good present-day fit but poor out-of-distribution behavior) remain visible.
Supporting better climate models
ClimateBench v2 is designed not only as a scorecard for finished models but as an active, multi-objective target for developing the next generation of climate models. Its standardized, machine-readable scoring pipeline can sit inside model development loops, including automated and agentic workflows that iteratively propose and refine model components.
This is how it is used within the lab. In MOSAIC, AI agents discover interpretable, physically constrained parameterizations from observations; candidate equations are implemented and calibrated in the differentiable JAX-GCM (JCM) atmospheric model, and ClimateBench v2 provides the rigorous, held-out evaluation that tests whether a discovered equation genuinely improves global model skill and robustness rather than just fitting the training data.
Code and data
All evaluation code, observational reference datasets and perfect-model training data are openly released. The benchmark implementation (Tier I gates, Tier II/III scoring, baselines and leaderboard) is developed on GitHub under the Apache 2.0 license and builds on the ClimateEval community diagnostic framework (itself built on ESMValTool). The CMIP6 evaluation results and derived reference data are archived on Zenodo. We invite the community to submit models, propose protocol improvements, and help build the evidential basis needed for accurate and trustworthy climate projection.
Learn more Code Data